Chapter 48
Building Pie Charts and Donut Charts
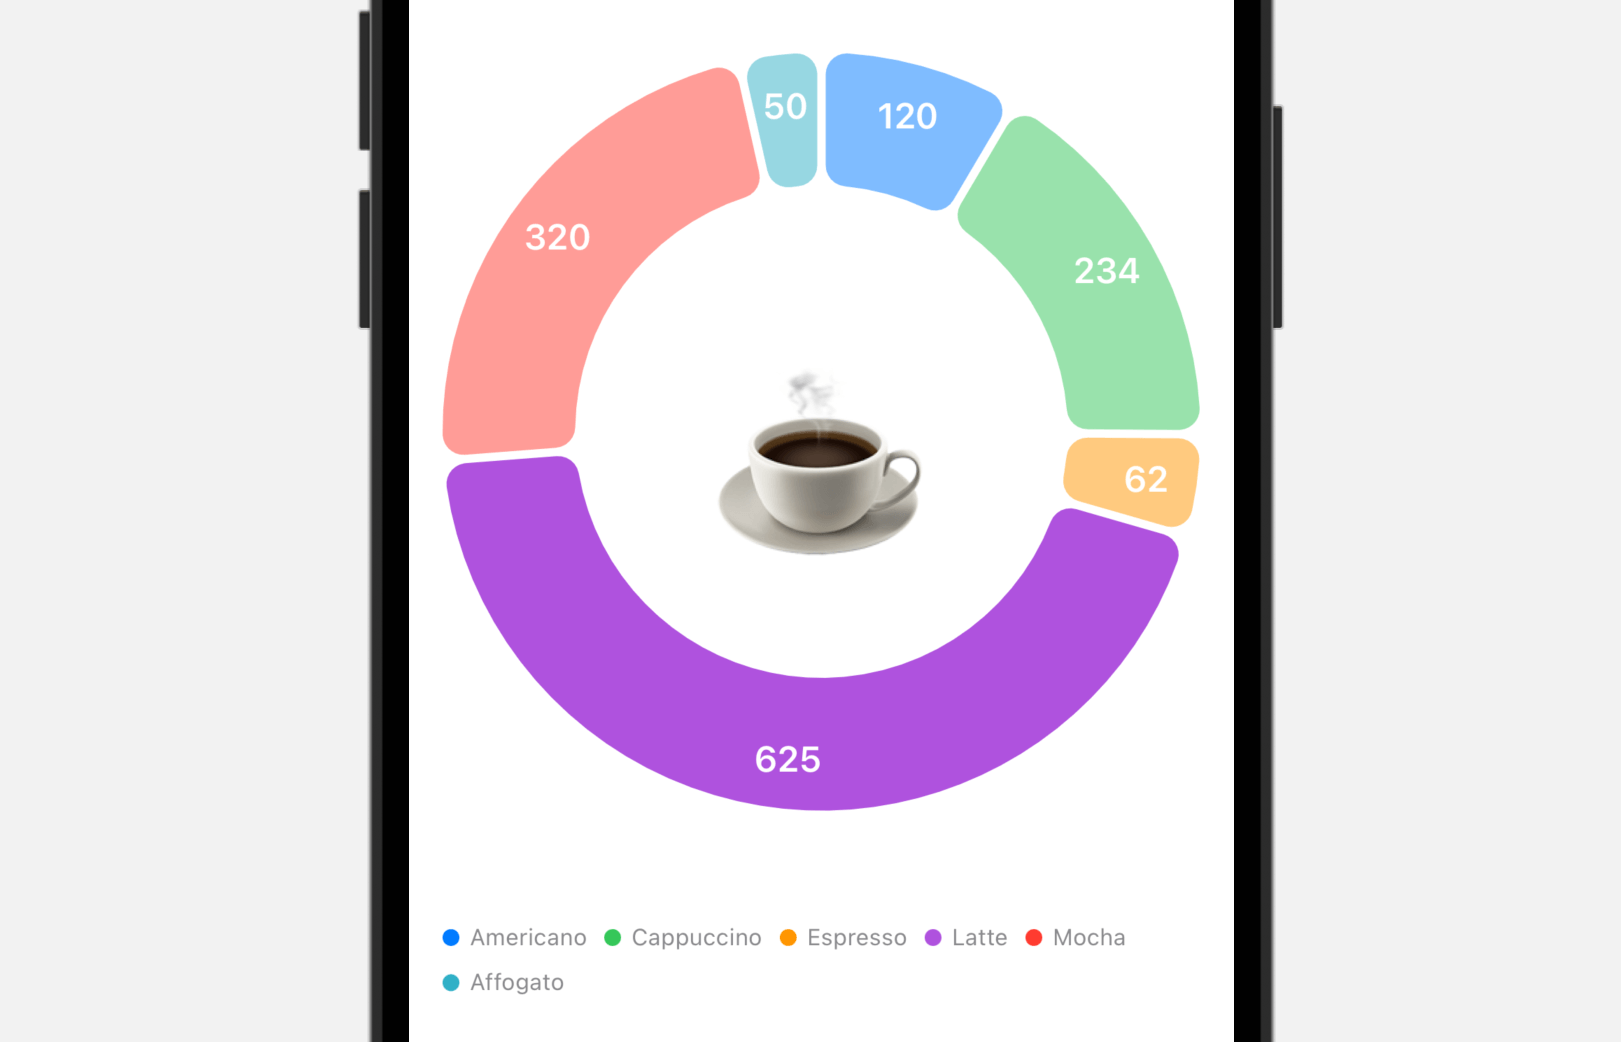
Pie charts and donut charts are two popular chart types used in data visualization. Prior to iOS 17, if you want to create these types of charts using SwiftUI, you’ll have to build the charts on your own using components like Path and Arc. In chapter 8, we showed you a technique on implementing pie charts and donut charts from scratch. However, since the release of iOS 17, this is no longer necessary. SwiftUI simplifies the process of creating these charts by introducing a new mark type called SectorMark. This makes it easy for developers to build all kinds of pie and donut charts.
In this chapter, we will guide you through the process of building pie charts and donut charts using SwiftUI. On top of that, you’ll also learn how to add interactivity to the charts.

To access the full content and the complete source code, please get your copy at https://www.appcoda.com/swiftui.